LevaData Bechmark
How to Use
“The LevaData Benchmark is a fair-market price band for a specific part and quantity. It’s built from anonymized real-world transactions and quotes across billions of parts and tens of thousands of suppliers, cleaned and normalized by our AI. We show you where your price sits in that band so you can see if you’re already good, okay, or clearly overpaying — and then decide whether to renegotiate or move on.”
language and practical analogies.
Short definition
How to use it
What it is not
Frequently asked questions about the LevaData Benchmark
Spot issues quickly. Use the benchmark range bar to see your price versus realistic market bands. Green = good, grey = okay, red = needs attention.
Focus on the biggest gaps. Prioritize parts where your price is clearly above the benchmark band. These are your highest savings opportunities.
Set clear negotiation targets. Use the benchmark range and alternatives to decide what to ask suppliers for (for example, “We see market ≈8% lower at this volume—let’s close that gap.”).
Know when you are already in a good place. When your price is at or better than the benchmark, you can confidently move on to other priorities.
The benchmark is like a thermometer for pricing. It doesn’t tell you if you are in the shade or full sun, but it tells you the real temperature so you know if things are in a safe range or if something is too hot and needs attention.
Many data sources, not a single feed. It blends company data, supplier data, and broader market data, then benchmarks prices across a very large electronics universe.
Massive coverage. Benchmarks are calculated over a footprint of hundreds of millions of parts and tens of thousands of suppliers across the electronics supply chain.
AI + ML cleanup. AI models normalize part numbers and manufacturers, remove bad data, and detect anomalies before benchmarks are computed.
Just as Zillow or Kelley Blue Book aggregate thousands of actual home or car sales to estimate a fair value range, LevaData aggregates vast amounts of real price and quote data to estimate a fair market price band for each part.
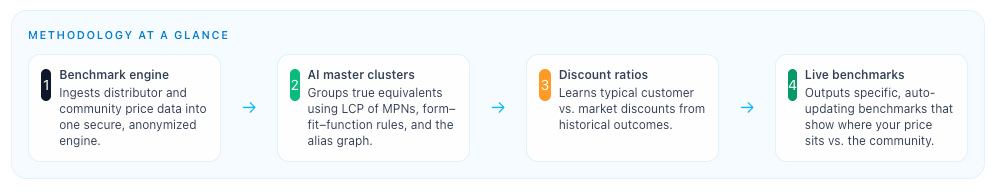
Benchmark engine. Ingests distributor price files, customer transactions, quotes, and market signals into a single, anonymized data pool.
AI master clusters. AI groups true equivalents using the logical core pattern (LCP) of MPNs, form–fit–function rules, and the alias/alternate graph so like parts are compared only with like parts.
Learned discount ratios. For each cluster, models learn the typical customer-vs-market discount from many years of deals and outcomes.
Live, auto-updating benchmarks. We use the community's average discount vs. distributor to set an achievable benchmark for each part and volume band:Benchmark ≈ Distributor Price × (1 − Community Avg Discount)
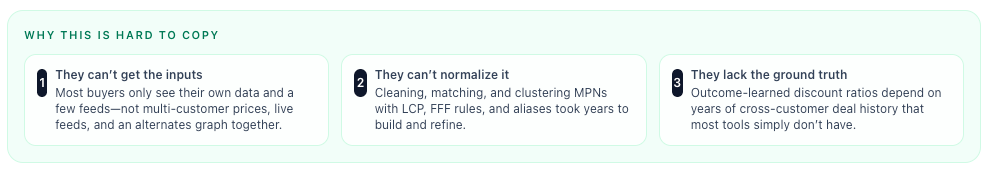
Why you need LCP in the first place
Traditional benchmarking assumes each full MPN is unique. In reality, that’s not how manufacturers behave:
The core of the MPN usually encodes the actual electrical / mechanical design.
The suffixes and prefixes often encode packaging, RoHS status, tape vs. tray, temperature range, minor options, and similar variations.
What LCP (Logical Core Pattern) actually does
The LCP algorithm looks at millions of part numbers and learns the stable core pattern that represents the true functional part—the “DNA” of the component—and separates it from the suffix noise.
It isolates the logical core pattern that defines the electrical and mechanical function.
It then layers on form–fit–function rules (voltage, tolerance, package, reliability, etc.) and the alias graph (equivalents and alternates) to build master clusters: groups of parts that are truly comparable.
Why this makes the benchmark more accurate
Once LCP has grouped true equivalents into clusters, LevaData can:
Pool much more data per “real” part. Instead of 10 thin price histories on 10 suffix variations, you get one rich signal on the underlying functional part.
Filter out invalid comparisons. By enforcing form–fit–function and alias rules, the model avoids comparing parts that look similar in text but are not interchangeable in practice.
Learn stable discount behavior per cluster. Within each LCP‑based cluster, the model learns typical customer‑vs‑market discounts across many deals, volumes, and time periods, so discount ratios are meaningful and stable.
Apply learned ratios to live distributor prices. That’s how you end up with a benchmark formula like: Benchmark ≈ Distributor Price × (1 − Community Avg Discount) where both the community discount and the “this really is the same part” assumption are grounded in the LCP clustering.
The methodology isn’t “set and forget.” LCP clusters are:
Stress‑tested against outcomes. If a cluster shows inconsistent pricing or behavior, it is a signal to re‑examine the mapping.
Continuously refreshed. As new parts, alternates, and deals show up, the alias graph and clusters are updated.
Guarded by anomaly detection. Bad prices, one‑off errors, or mis‑coded parts are flagged and down‑weighted so they don’t distort the band.
The LevaData Benchmark methodology is like decoding car VINs across thousands of dealerships: it figures out which cars are truly the same model and trim, learns what people actually paid vs. sticker, and then tells you the fair price when you walk onto any new lot.
Think of the LevaData Benchmark methodology like a car-pricing engine. We pull in listing prices and actual sale prices from thousands of dealerships (suppliers and distributors). LCP is like decoding the VIN so we know which offers are really the same car—same model, engine, and trim—not just similar-looking ads. Once we’ve grouped those true equivalents, we learn the typical discount people actually get off sticker. Then, when you look at today’s distributor price for your part, we apply that learned discount to show a fair, achievable benchmark. It’s the difference between guessing at a car price and walking into the dealership knowing exactly what people really pay for that exact model.
Multi-customer view. ~$100B+ in observed spend, more than a million parts, and thousands of manufacturers give a broad view of how the market really behaves.
Live market signals. Distributor and vendor prices with real-time movement keep benchmarks anchored to what is happening now, not last year's rate sheet.
Alternates graph (LCP / FFF / alias). Master clusters connect true equivalents using logical core patterns of MPNs, form–fit–function rules, and the alias graph, so the system understands when A, B, and C are genuine alternatives.
Outcome-learned targets. Models learn discount ratios per cluster from real outcomes (won prices, volumes, timing), so benchmarks reflect what buyers like you have actually achieved.
Grounded in real price/volume behavior. It analyzes actual transactions and quotes with their associated quantities and price breaks.
Tuned to your volume band. Where data allows, the benchmark is biased toward transactions at volume bands similar to yours.
Expressed as a band, not a single point. Because the market behaves differently at small vs. large volumes, it presents a realistic range rather than one “perfect” number.
Milk costs less per gallon at Costco than at a corner store because of volume. The LevaData Benchmark understands those patterns and uses them to suggest a fair price range for your volume, not someone else’s.
Global input, local relevance. Data feeds include transactions and quotes from Americas, EMEA, and APAC across thousands of suppliers.
Currency and term normalization. Currencies and, where visible, typical commercial terms are normalized to derive a region-agnostic reference.
Used as a reference, not a contract price. Think of it as a realistic global market anchor that you compare against your own regional situation.
Like a global oil benchmark, there is one reference price but your pump price varies with taxes and logistics. The LevaData Benchmark is the reference price you can test your local reality against.
Data over opinion. Benchmarks are derived from large-scale, real transaction and quote data—not rules of thumb.
Continuous data quality. AI models continuously clean and monitor data, remove outliers, and improve mappings so benchmark bands rest on high-quality inputs.
Proven in production. Manufacturers and brands across electronics use LevaData Benchmarks to reduce procurement costs and improve margins.
A guide, not a mandate. The Benchmark says “this is where the market usually is,” so you can justify actions: push suppliers, hold the line, or accept justified premiums.
GPS uses millions of data points to estimate your arrival time. A meat thermometer tells you when food is safe. Neither replaces your judgment, but both are far better than guessing. The LevaData Benchmark plays the same role for price.
Deep spec and qual nuance. Even with LCP, form–fit–function rules and aliases, there can be subtle differences in grade, reliability, qual, or lifecycle that matter for your program.
Community mix vs. your profile. The benchmark reflects a community blend of industries, regions, EMS/OEM mixes, and volumes. Your portfolio may be more regulated, more niche, or structurally different.
Non-price commercial value. Extended terms, rebates, stocking, NRE spread, services, and risk coverage may not show up in the unit price field, so they sit outside the benchmark band.
Thin data and cold-start parts. For new, niche, or low-volume parts, the benchmark may rest on limited observations or extrapolation, so the band is less robust.
Think of these as the edges of the map: the Benchmark gives you the terrain, but you still bring your own judgment for tricky, thin-data, or highly constrained cases.
Your profile vs. the community. If you have higher volumes, better consolidation, or strong category strategies, you may be able to aim near the low end of the band. If you’re smaller or more constrained, the middle or upper band may be realistic.
Existing programs and contracts. Direct manufacturer agreements or strong distributor programs are leverage: you can use the Benchmark to show there is still room to close the gap, rather than starting the discussion from list prices.
Total economics, not just unit price. You can decide how much to trade between unit price and other value: payment terms, rebates, stocking, flexibility, and service levels. The Benchmark gives the price spine; you decide how to shape the full package.
Strategic relationships and design-ins. Your design wins, roadmap alignment, and long-term supplier relationships often justify aiming for better-than-average outcomes within the band.
How hard you lean on the Benchmark in volatile markets. In stable conditions, you may treat the Benchmark as a firm negotiation anchor. In volatile periods, you may use it more as a sanity check alongside live quotes, allocation, and lead-time signals.
Use the LevaData Benchmark as the centerline that shows where the market usually sits. Then layer on your own leverage—volumes, contracts, relationships, and risk appetite—to decide whether you should be near the low, middle, or high end of that band.